
A few months ago I was chatting with a well known growth hacker named Dmitry Dragilev from Criminally Prolific. He was telling me about some of the blog posts he was ranking for on the first page of Google.
I took a look at one of his posts and realized something…
His images sucked.
In fact, he barely had any.
Knowing that engaging images are key to increasing time on site and improving SEO, I made him a special proposal.
I offered to create custom graphics for one of his blog posts if he agreed to measure the impact and provide me with the stats. Without hesitation, he agreed.
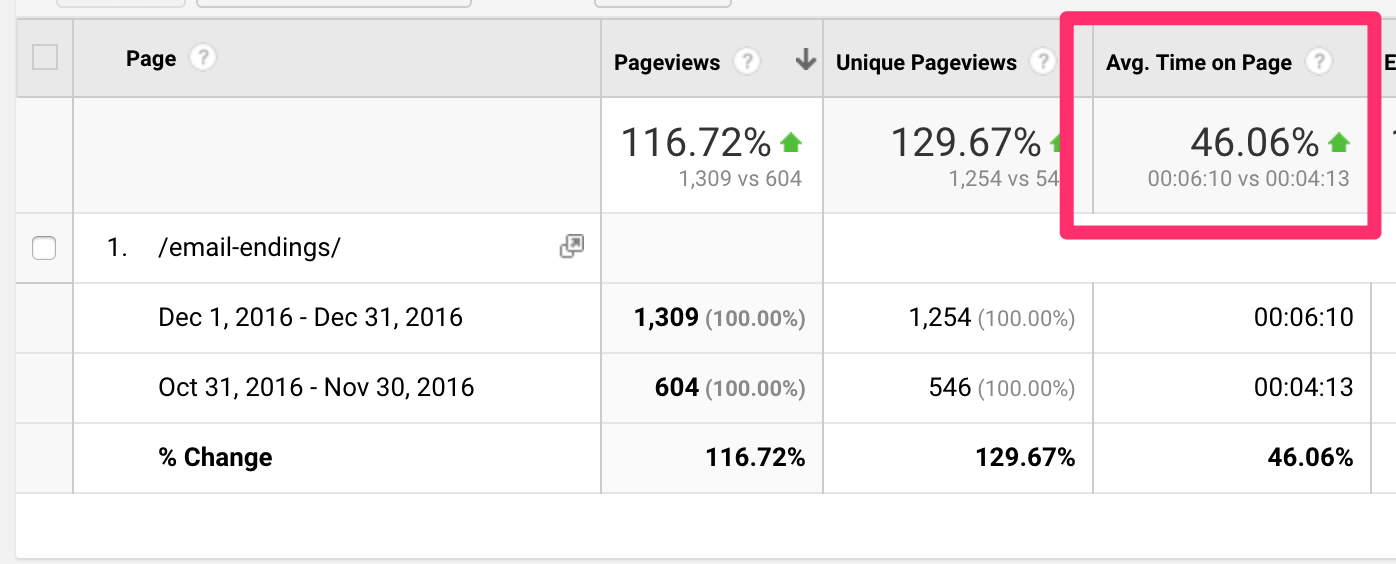
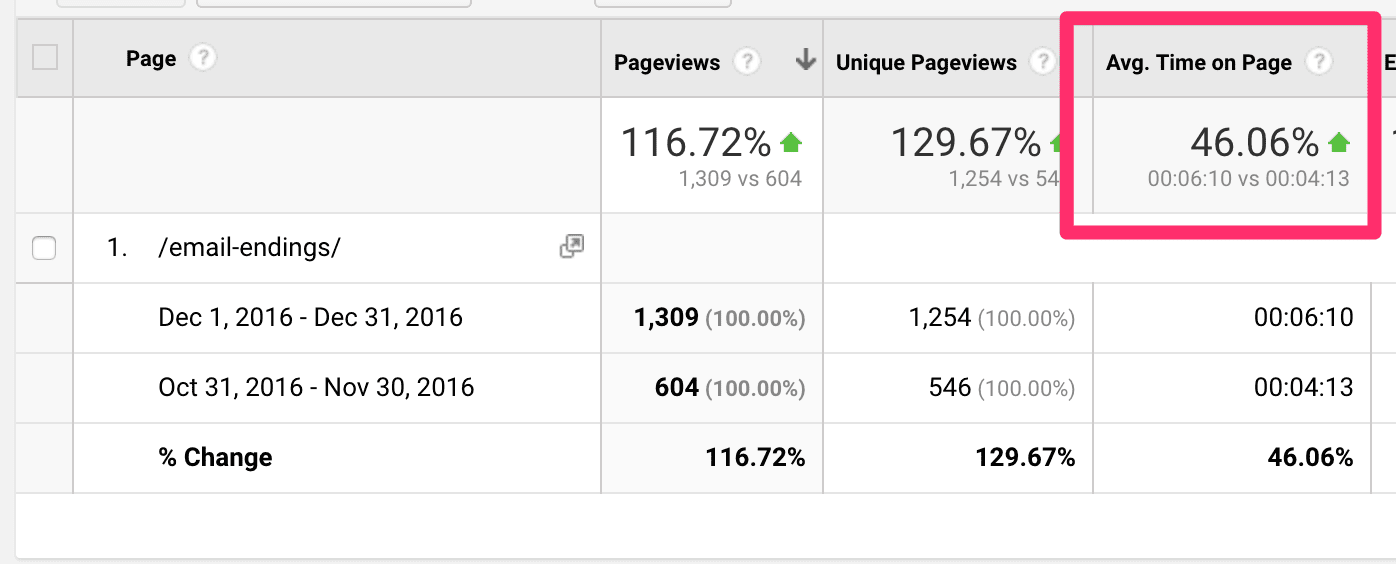
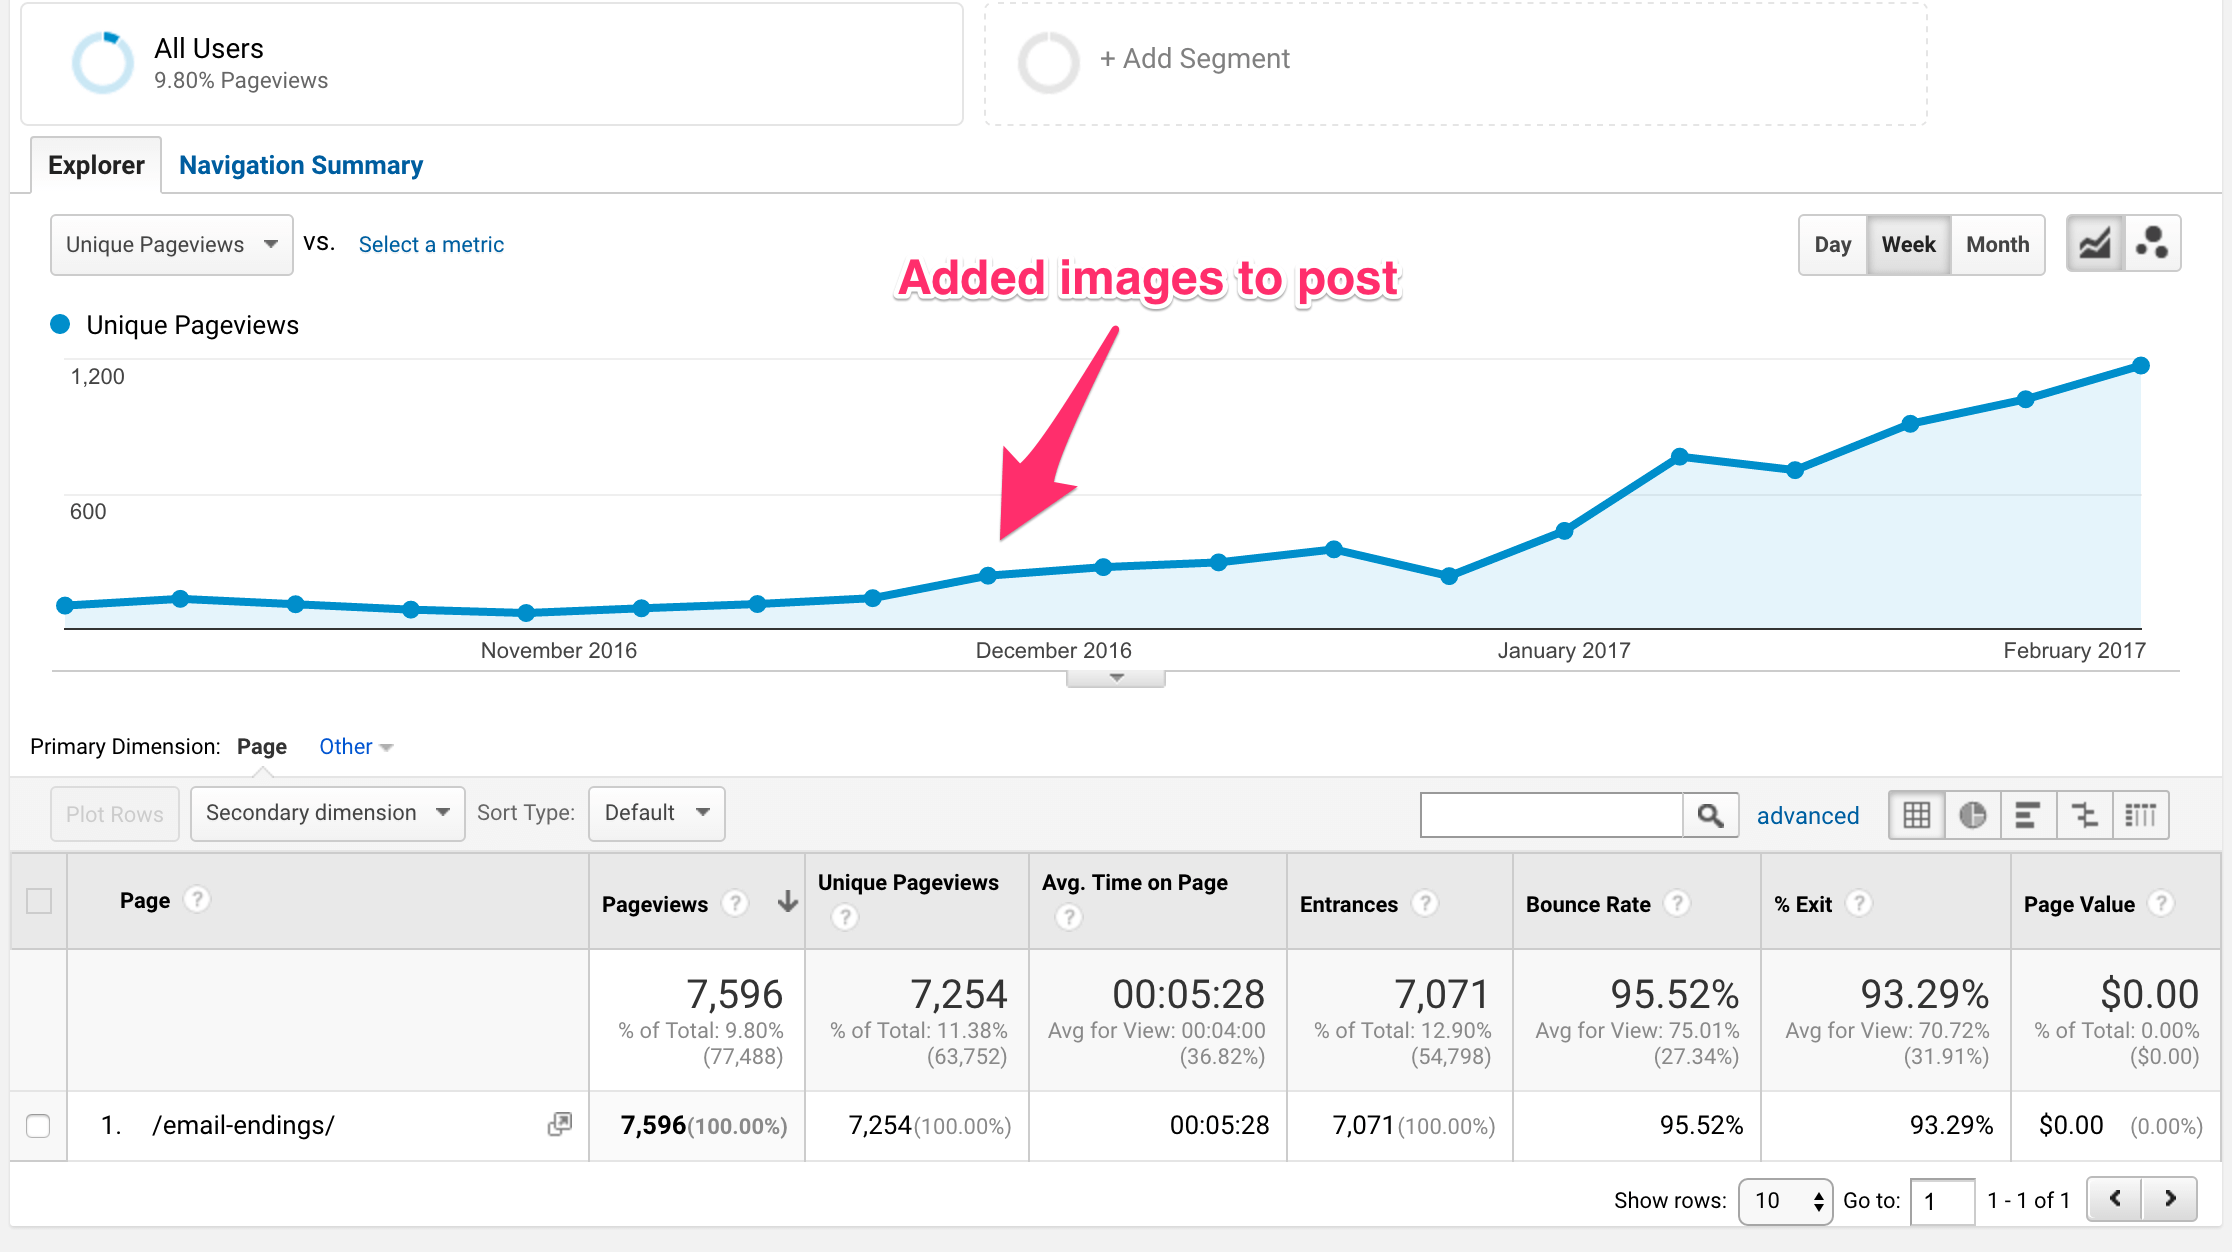
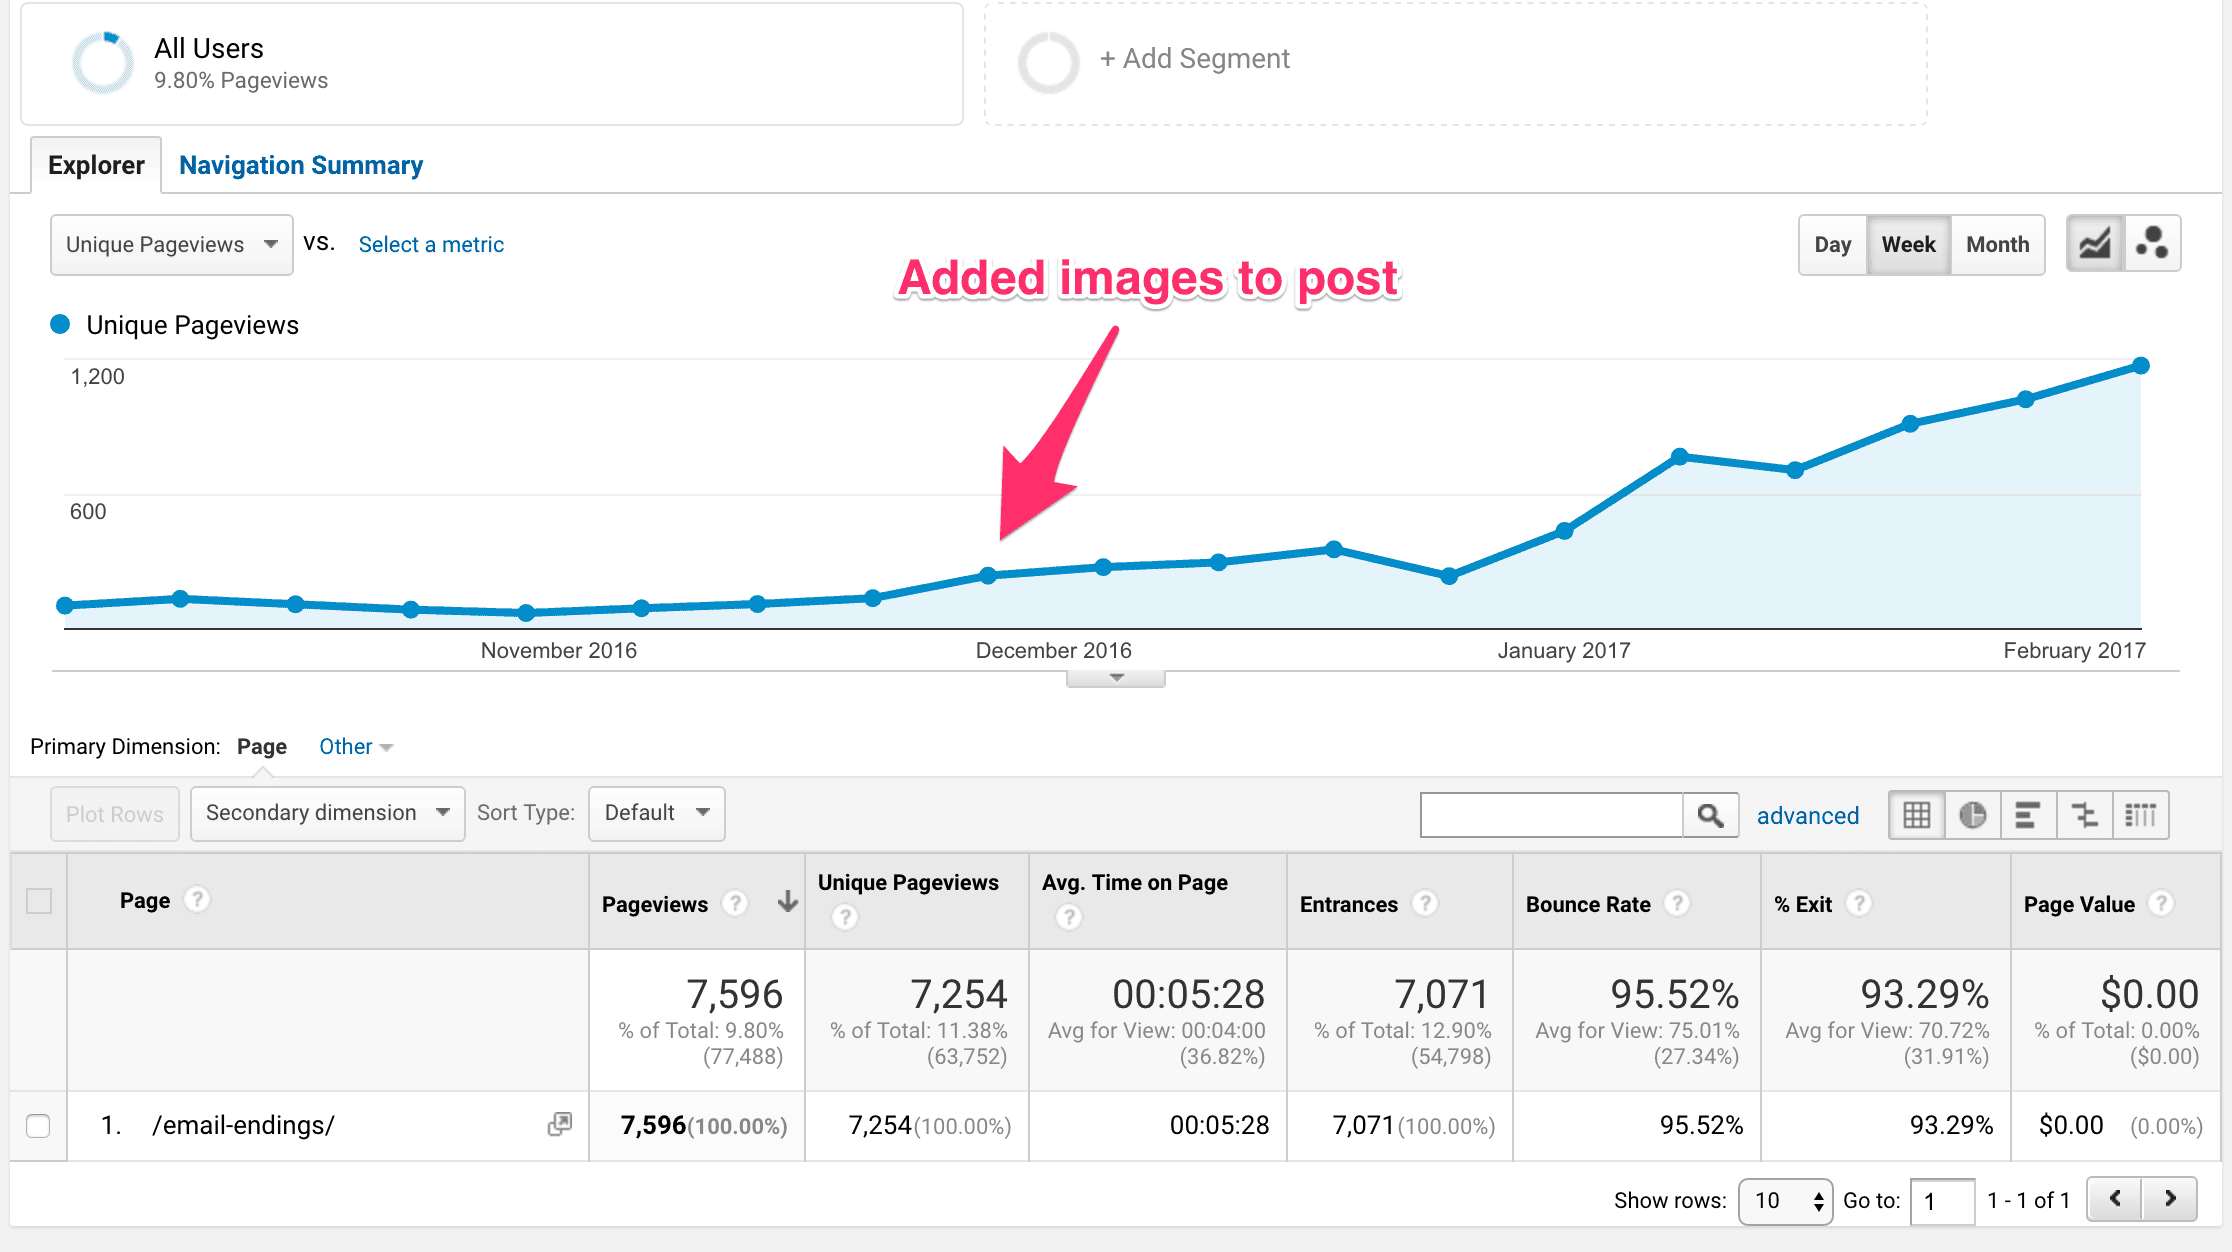
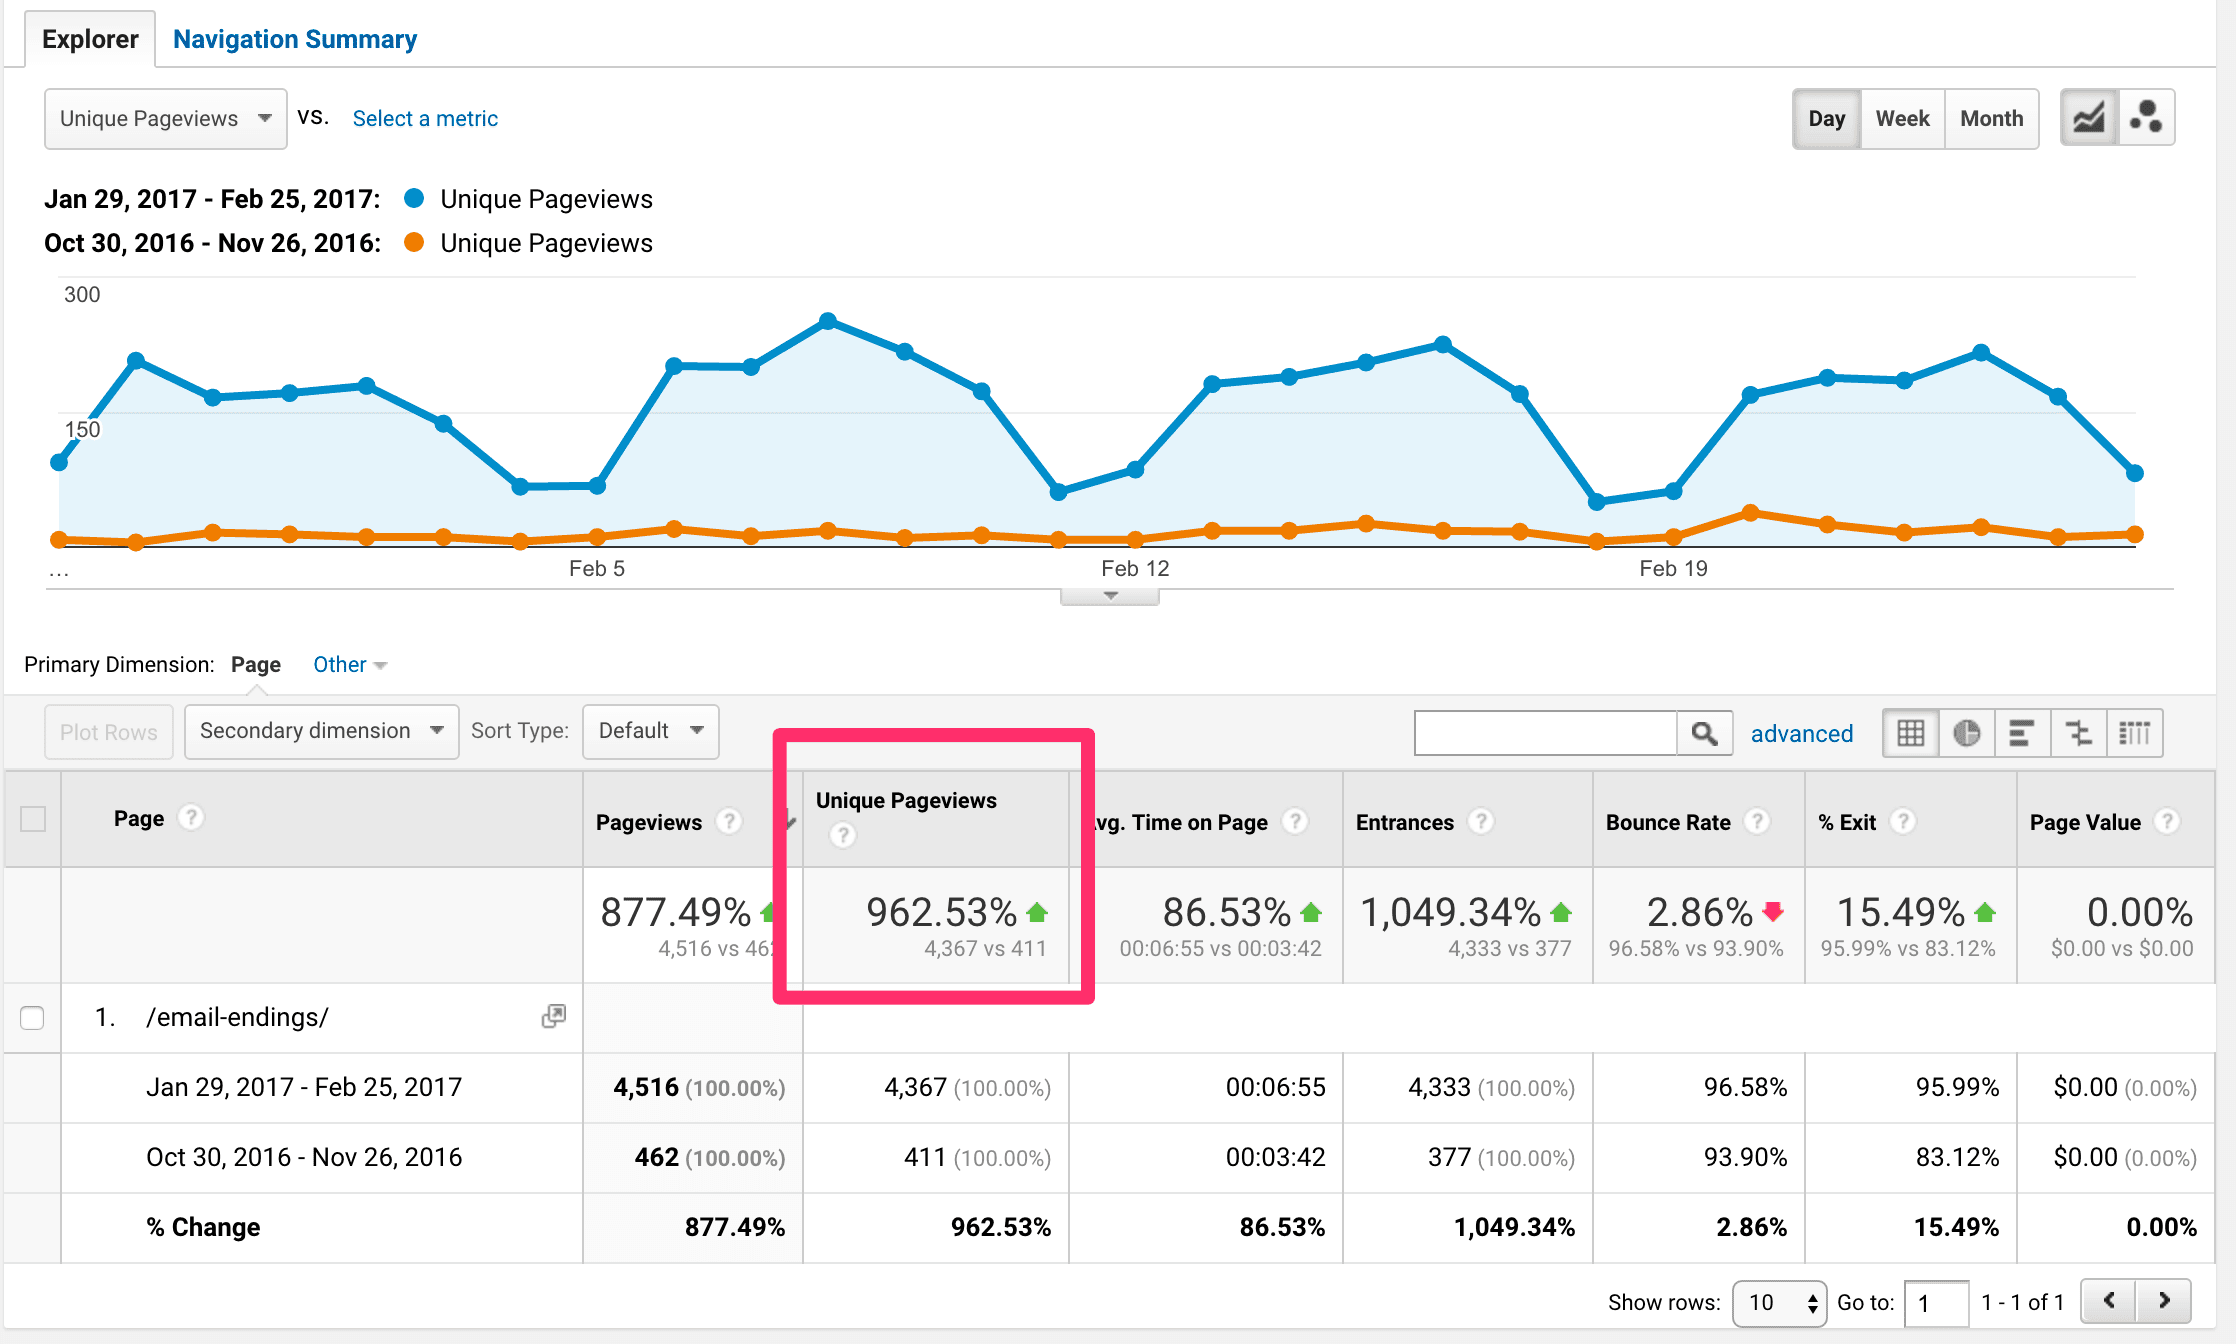
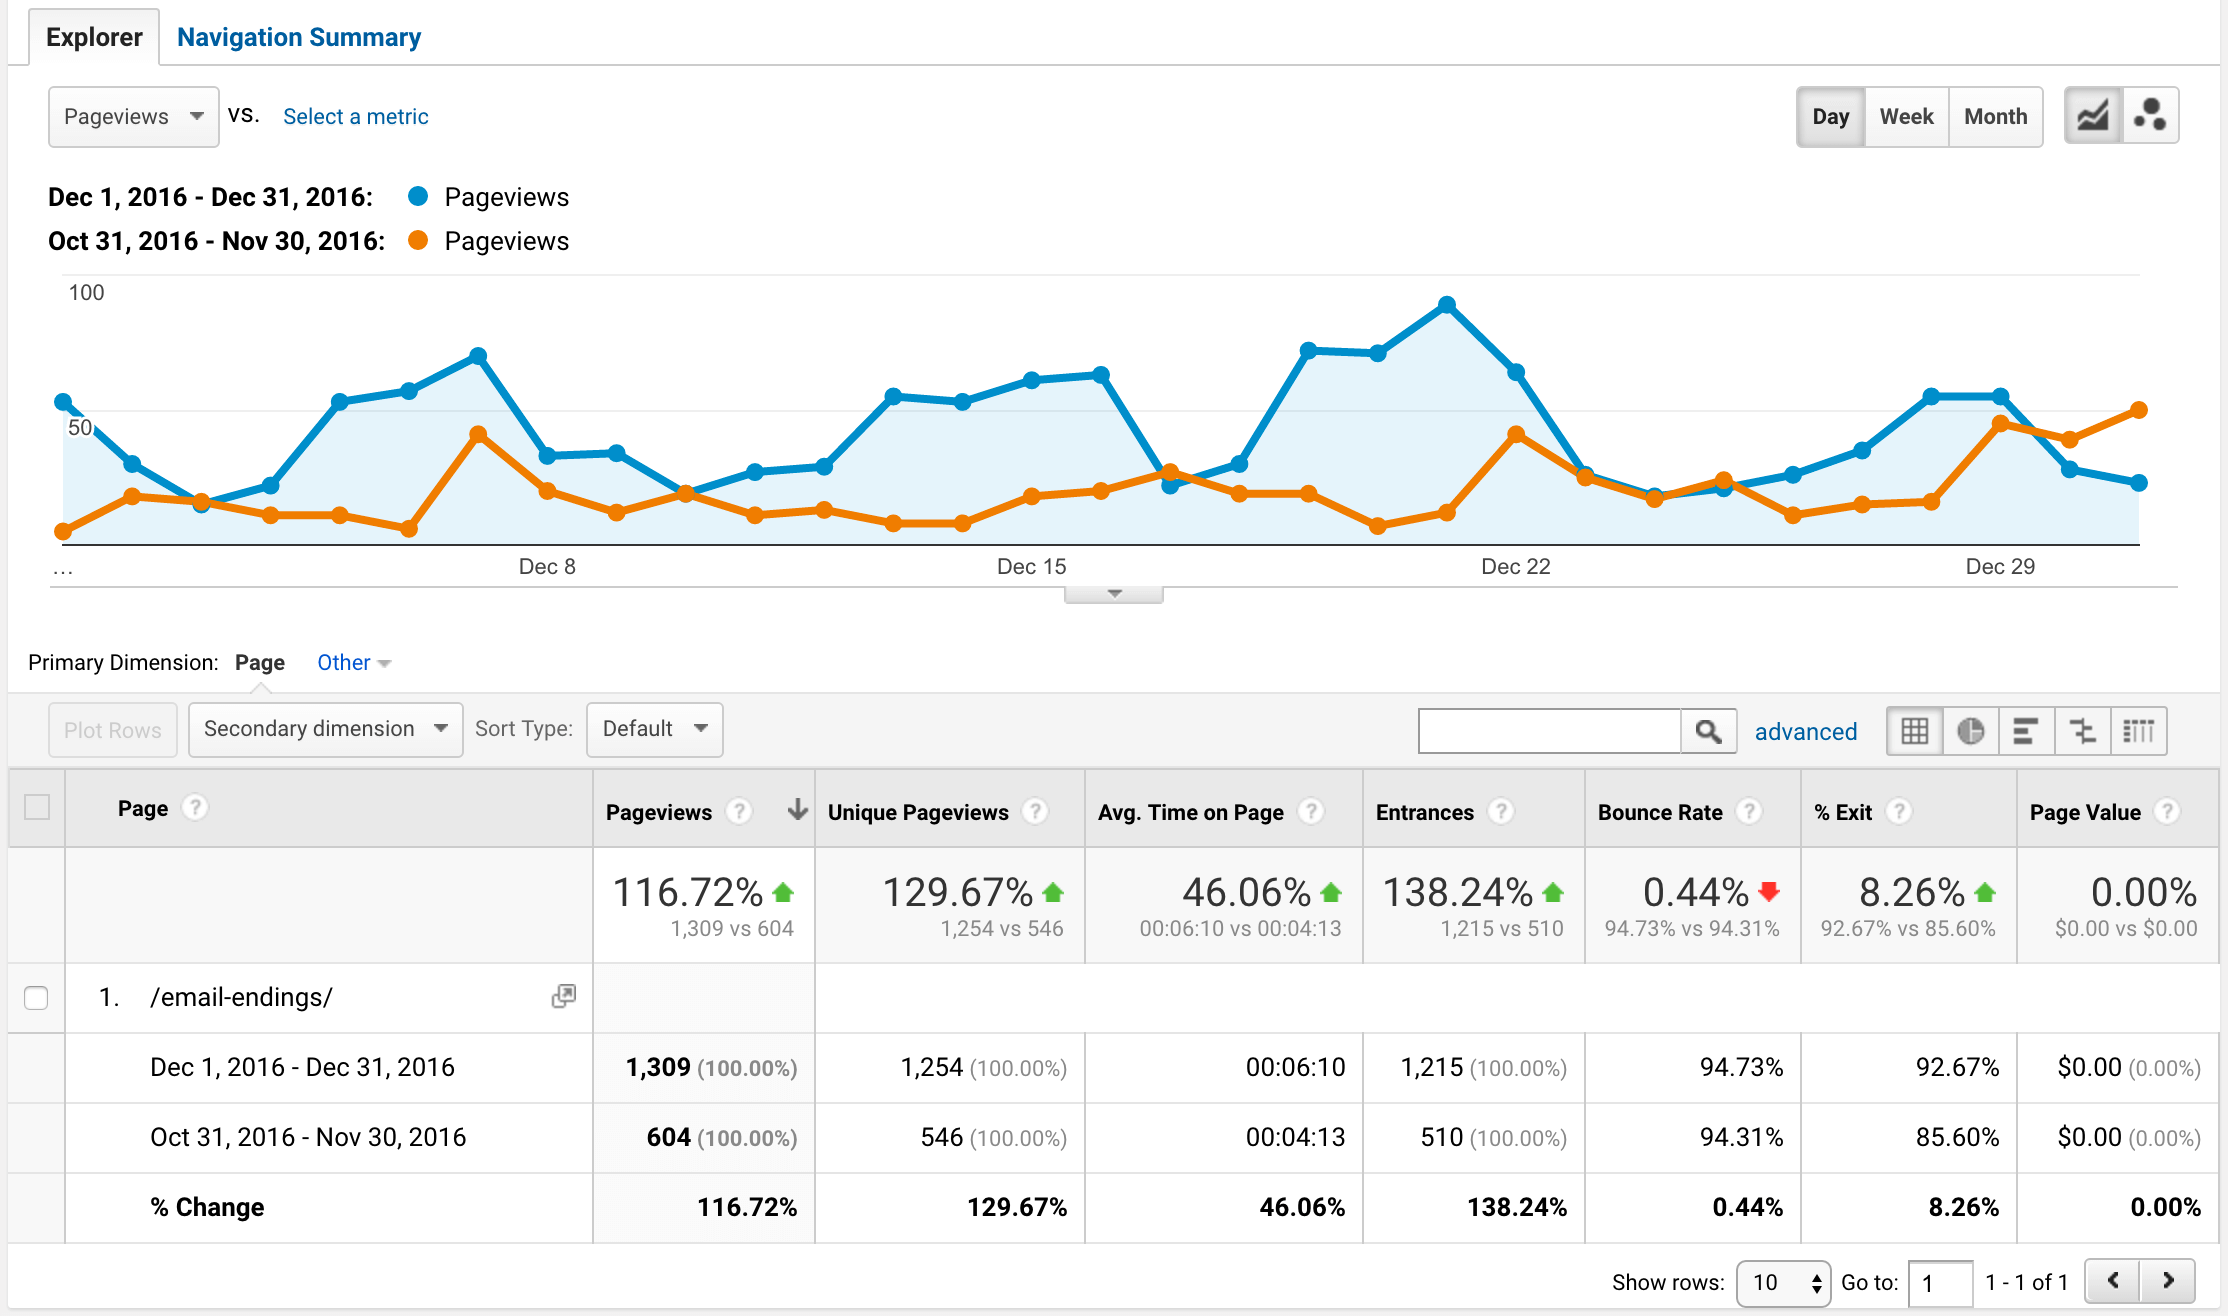
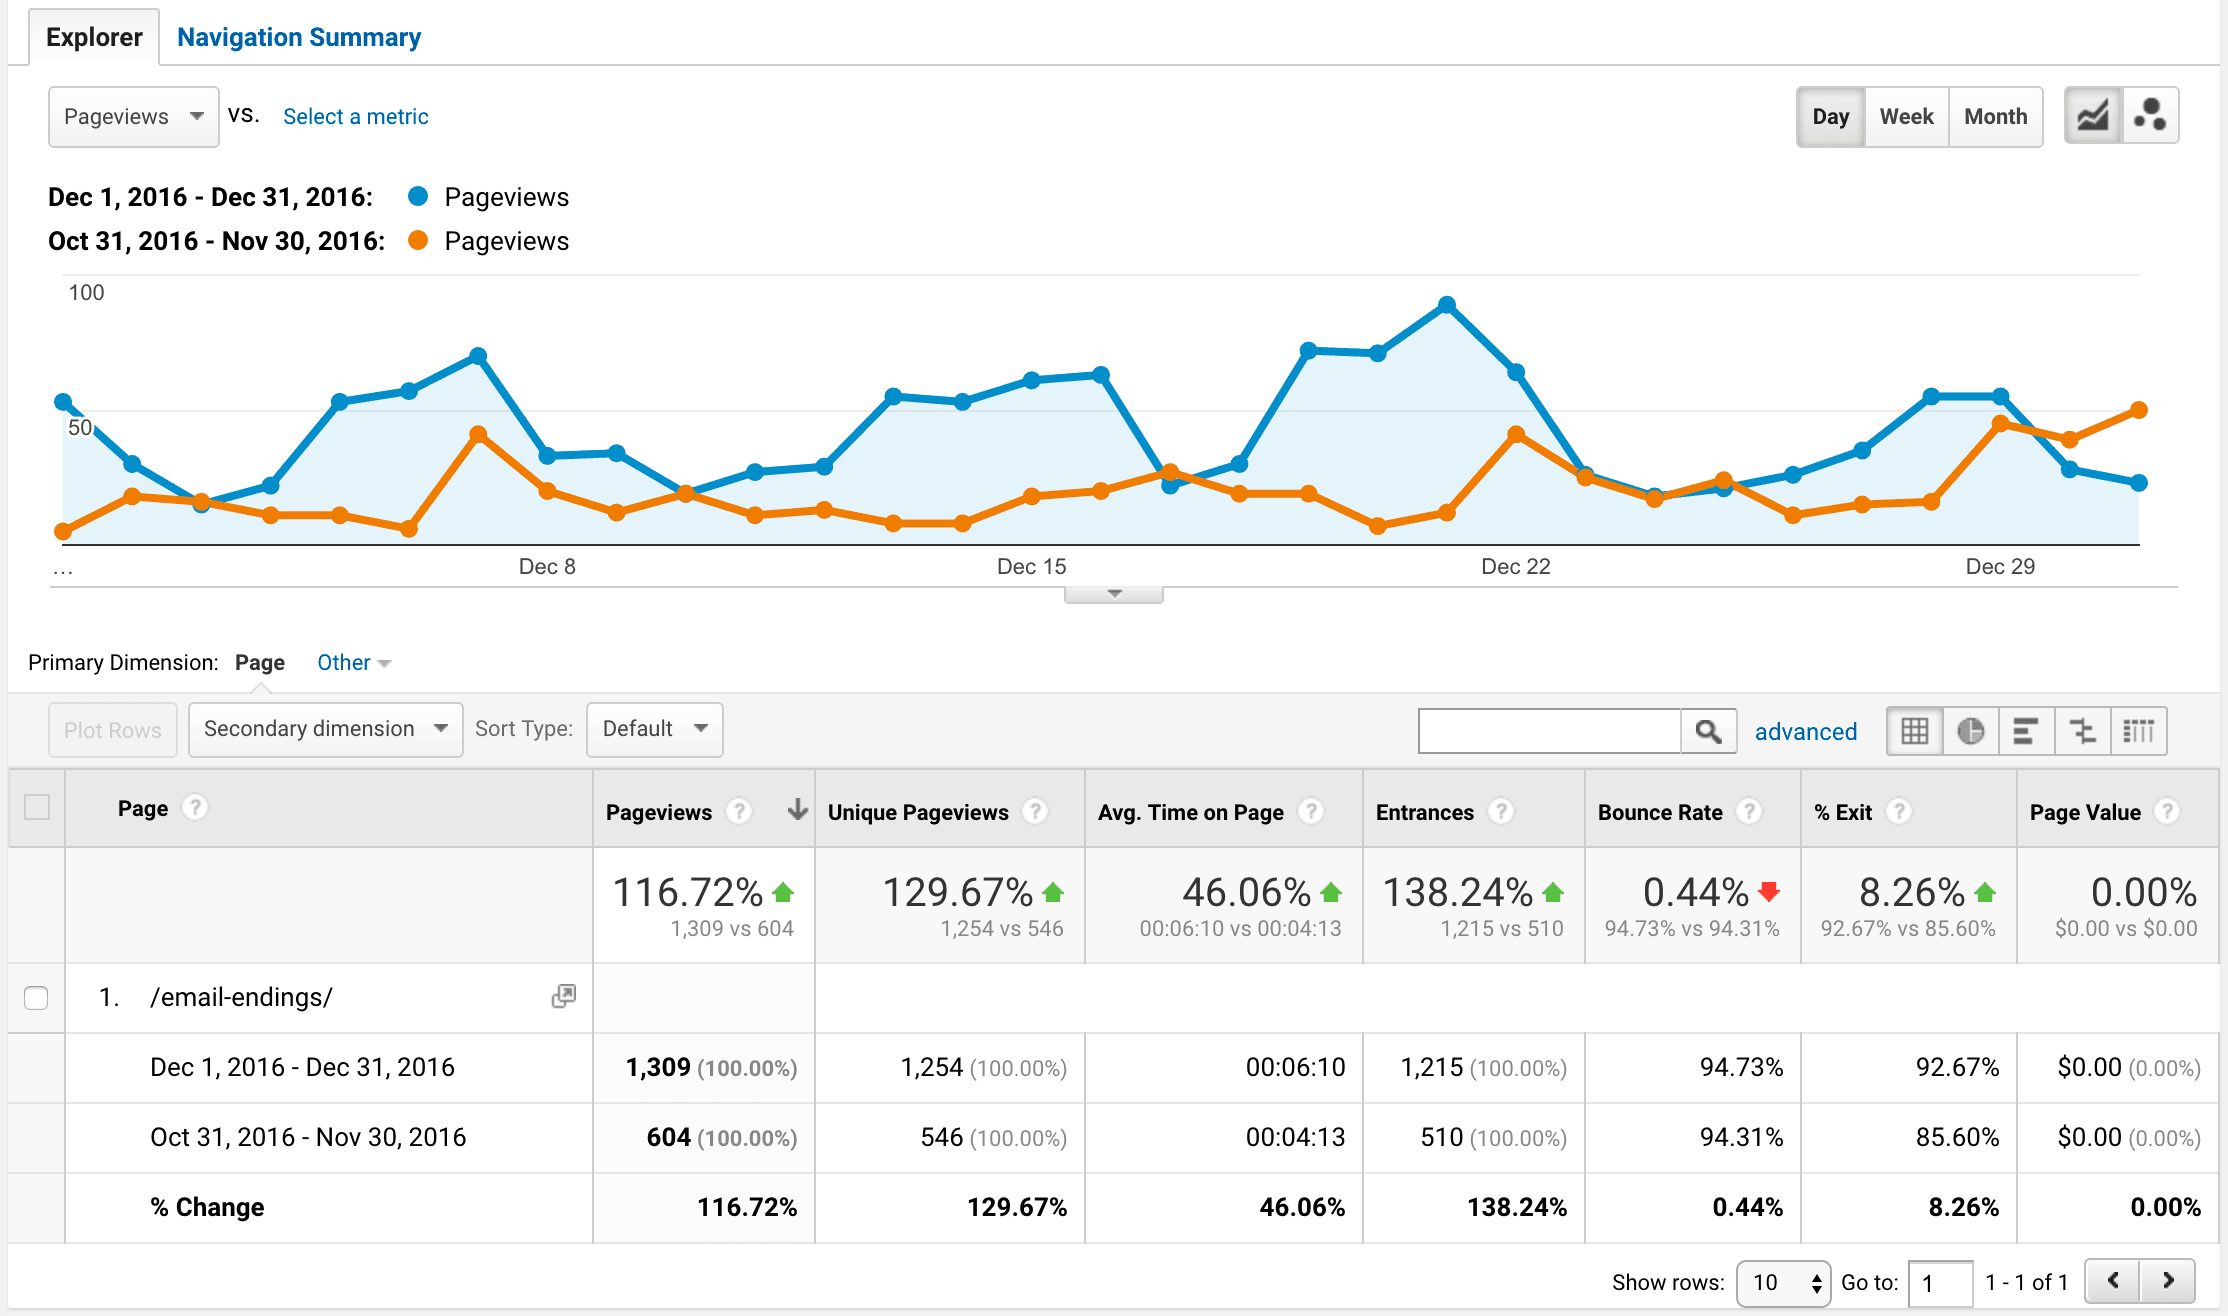
Then, just one month after I added the custom graphics to his post, the average time on site for his email endings post increased by 46%.
What’s even crazier? In the next two months, he jumped to #2 on Google for “email endings” and his traffic increased by 962%.
Needless to say, Dmitry was pleasantly surprised!
In this case study, I’ll discuss how I improved Dmitry’s post with custom graphics and walk you through the exact step-by-step process that Dmitry now uses to improve his time on site.
Why Is Time on Site Important?
The amount of time that someone spends reading your blog post is now more important than ever.
That’s because Google uses this as a ranking signal.
Think about it this way…
If Google were to show your blog post in the search results but everyone left as soon as they clicked on it, that’s a pretty strong signal that your post was unable to provide value to the user. If that’s the case, Google is going to stop showing your post.
On the contrary, if a user clicks on your post and spends a lot of time reading it, that’s a strong signal that the user is engaging with your content. If that’s the case, Google will continue showing your post in the search results, and in some cases, move it further up the rankings.
Although there are a reported 200+ Google ranking factors, dwell time (how long people spend on your page when coming from a Google search) plays a big factor.
We can thus reasonably assume that the longer people spend on your page, the better it is for your search engine rankings.
Dmitry’s Process for Boosting Rankings With Custom Graphics
After seeing the impact that adding custom images had, Dmitry was ready to try it on additional posts.
However, Dmitry has published over 100 posts on his blog. Going back and adding images to 100 posts would take a lot of time and in some cases might not be practical.
In order to maximize the impact of this technique, here is the 4 step process Dmitry is using on his blog:
- Identify posts that are already ranking in Google
- Create custom graphics for the post
- Upload custom graphics with appropriate alt tags
- Monitor the results using Google Analytics and Webmaster Tools
Step 1: Identify Blog Posts That Are Already Ranking in Google
If you’re like Dmitry, you probably have a lot of articles published on your blog. If that’s the case, going back and adding images to all of your posts is probably out of the question.
However, if some of your posts are already ranking in Google (ideally on one of the first three pages), simply adding custom graphics can have a big impact on the performance of the post.
To identify your best performing posts, go ahead and open your Google Search Console (aka Webmaster Tools).
Under the “Search Traffic” dropdown, click on “Search Analytics.” Then click on the “Pages” radio button.
This will give you a list of your top organic pages.
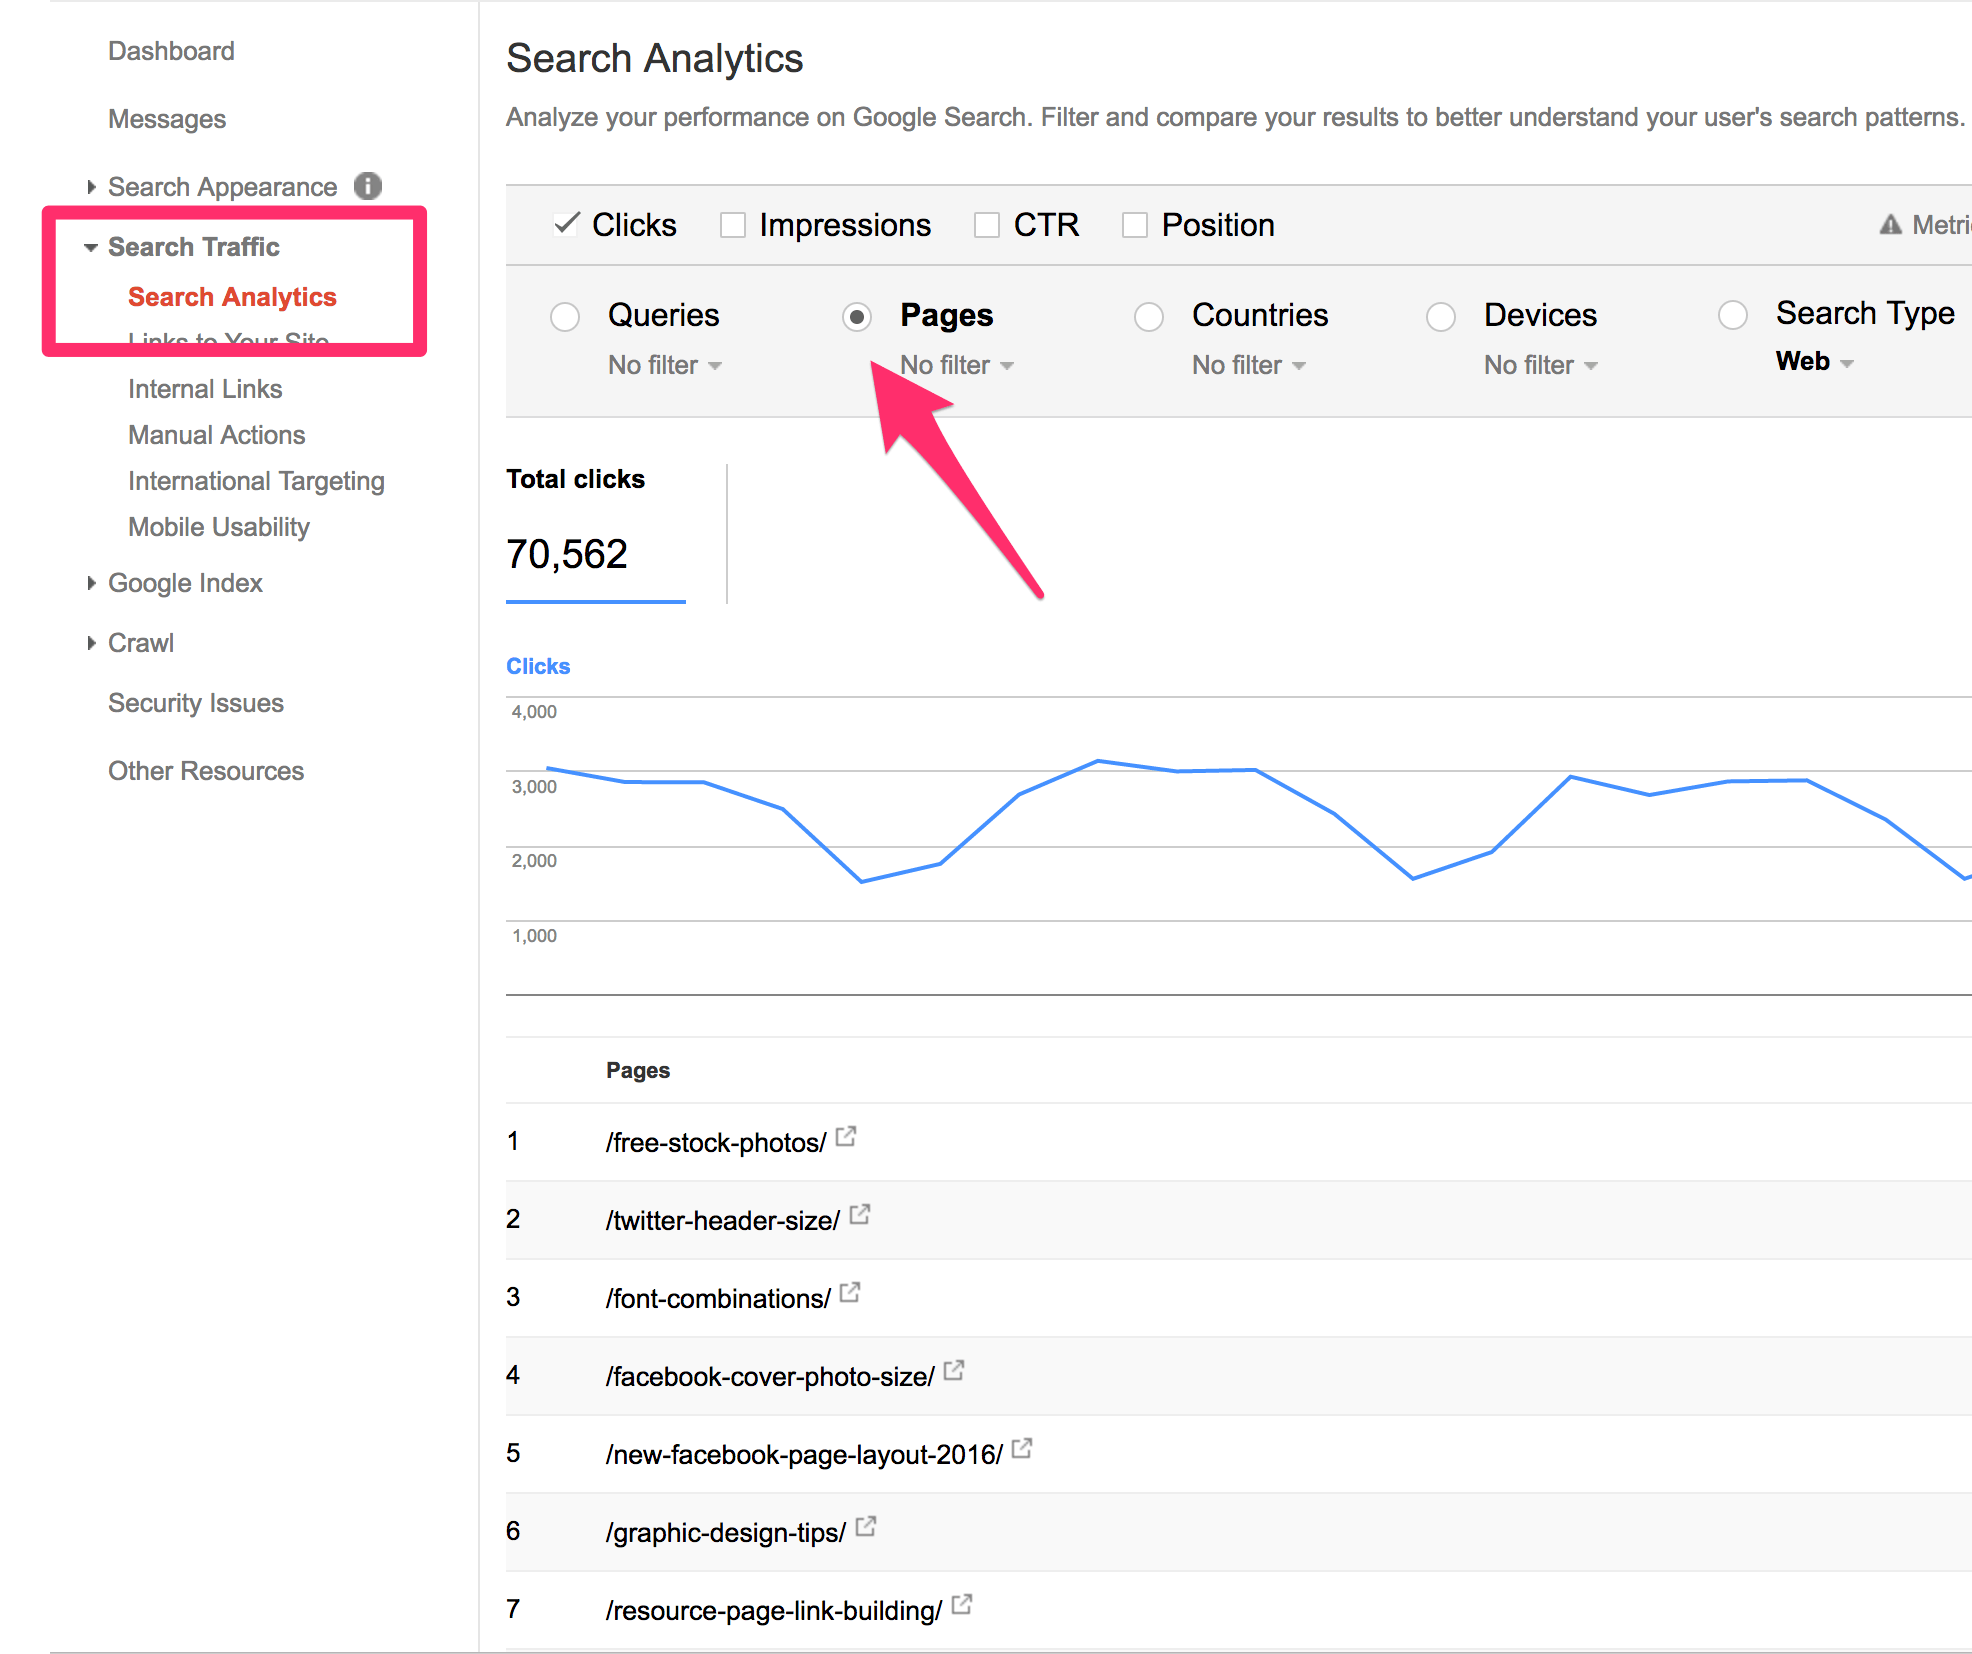
Using this report, you can quickly identify which posts are bringing in the most organic traffic. Compile all of the URLs in a spreadsheet or word doc.
You can also use premium tools like SEMRush and AHREFs to perform this type of work.
Once you’ve compiled the list, manually review each of the blog posts.
Does the blog post contain any images at all?
Is it full of cheesy stock images?
Based on your review, determine which posts are in need of a visual overhaul and proceed to step 2.
Step 2: Create Custom Graphics For The Post
Contrary to popular belief, you don’t need to be a graphic designer in order to create engaging images for your blog.
In fact, I purposely kept Dmitry’s images very simple to prove that anyone can do this. Here’s a screenshot from Dmitry’s post:

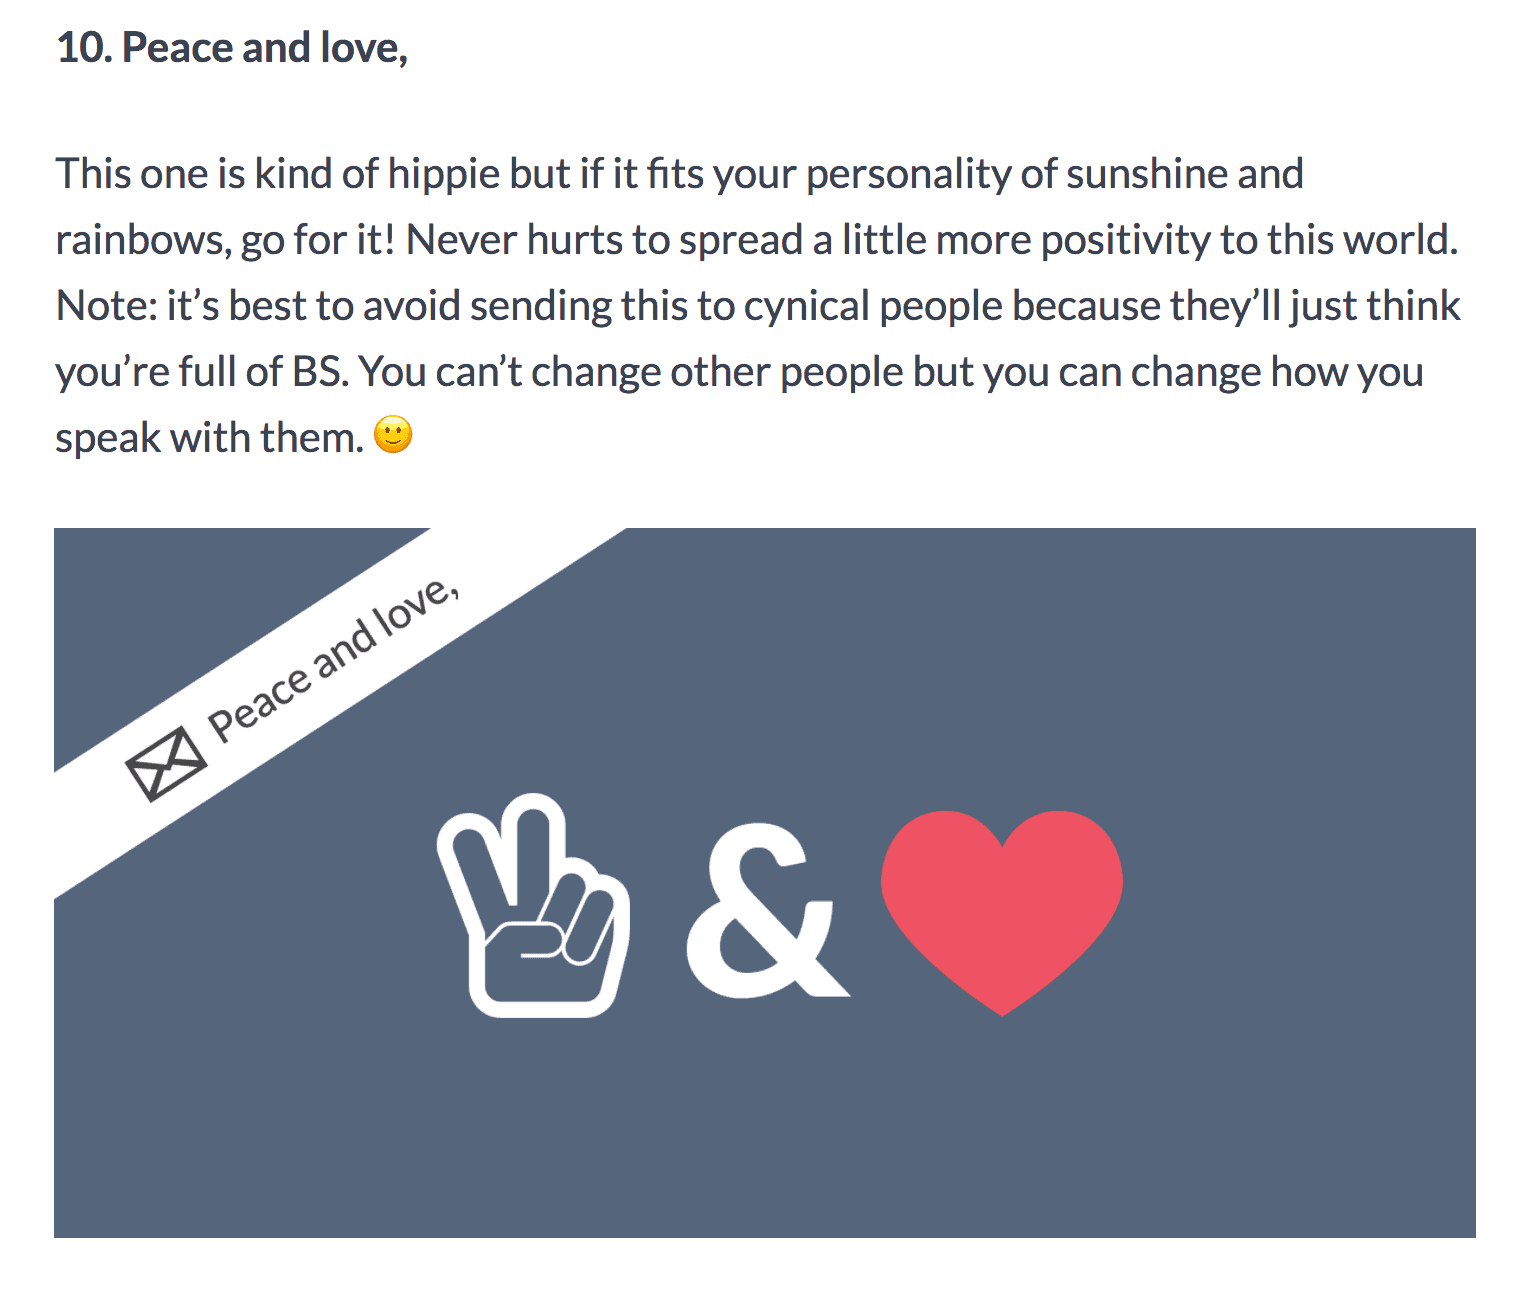
And here’s another one:
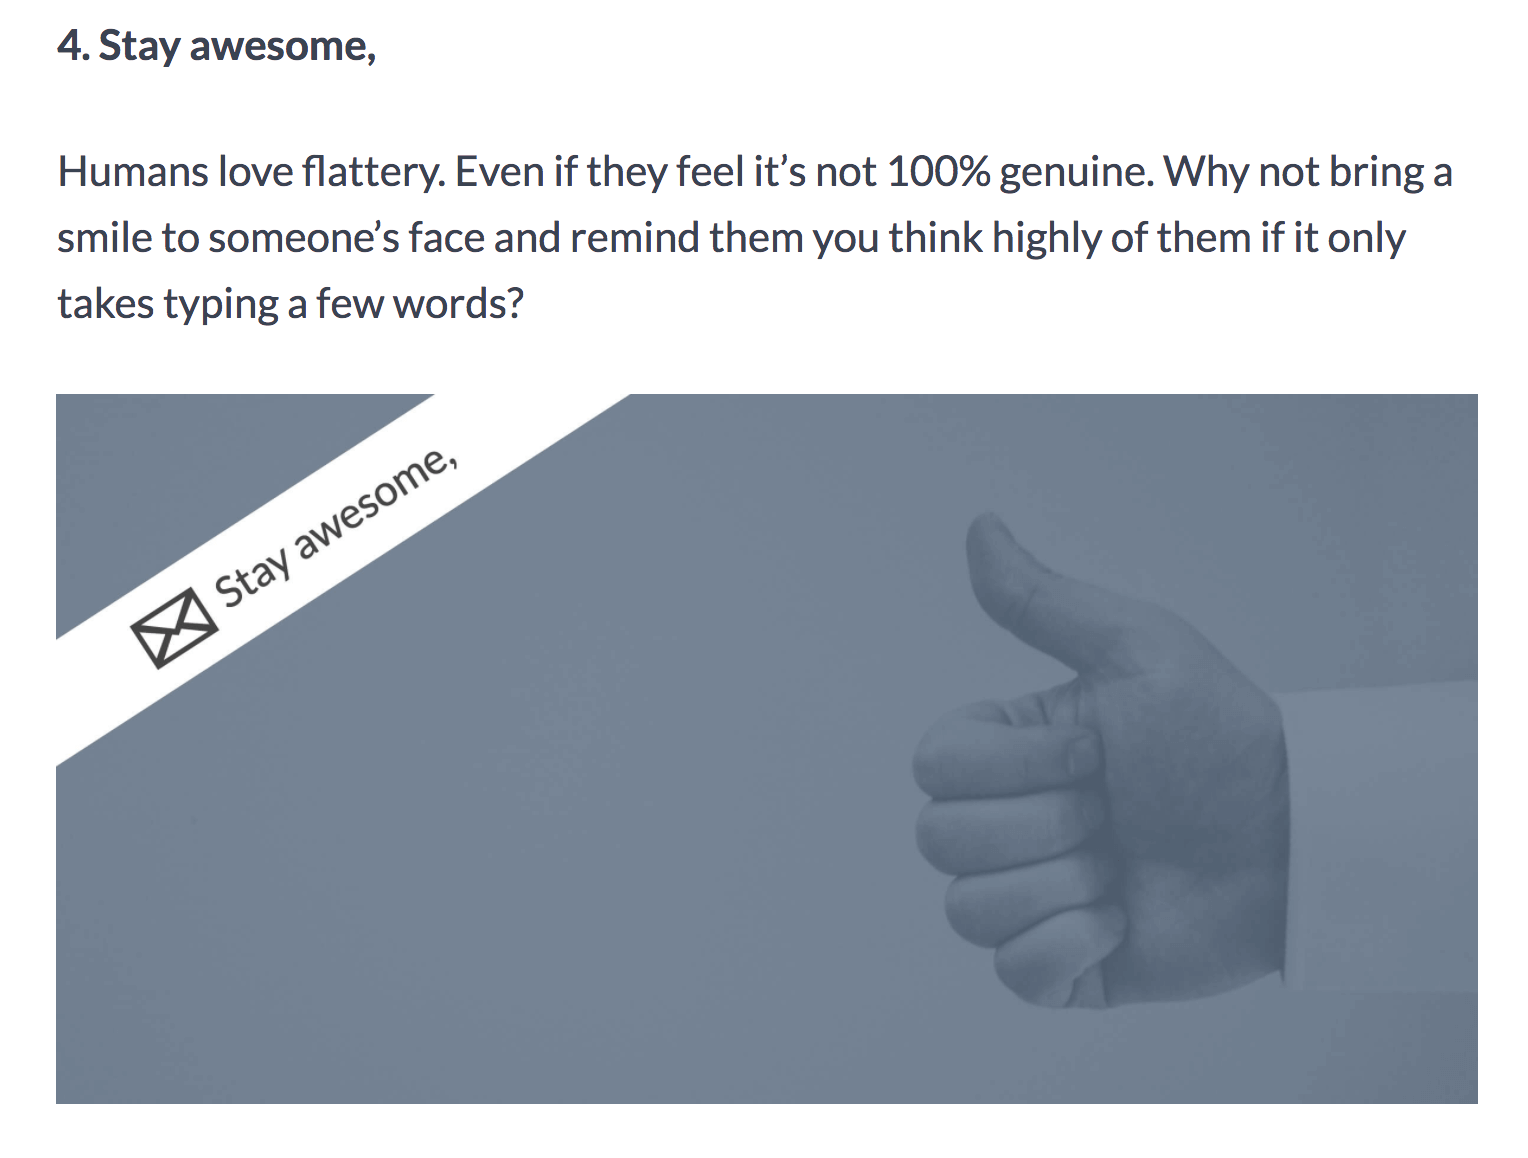

As you can see, the images are very effective but they’re not going to win design awards either. Each image took just a few minutes to create with Snappa.
When creating images, here are some basic graphic design tips to keep in mind:
- Start With a Great Color Palette: Use a website like ColourLovers, Coolors, and more color palette resources to establish great colours in your design. For Dmitry’s images, I stuck with his brand colours.
- Ensure Proper Contrast: If you’re using a dark background, make sure you’re using light text (and vice versa).
- Keep It Simple: Often times, the most simple designs tend to be the most effective. Unless you know what you’re doing, don’t go overboard.
You may not even need to design graphics at all! For this post, I’m using strictly screenshots since that’s what the post calls for.
Step 3: Upload Custom Graphics With Appropriate Alt Tags
At this point, you’ve already done all the heavy lifting. Now comes the easy part!
Simply add all of your custom graphics to your post and ensure that you add proper alt text for SEO Purposes.
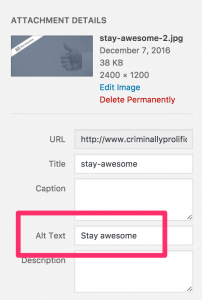

If you’ve added a lot of custom graphics and altered the content, you may also want to consider updating the publish date.
Step 4: Monitor Results
Now that you’ve added the custom graphics to your post, you’ll want to monitor the results. To do this, you’ll need to run the appropriate reports in Google Analytics and Webmaster Tools.
Tracking Avg Time on Site
To track the average time on site, you can view the Behaviour -> Site Content -> All Pages report in Google Analytics. This shows all of your most popular pages and a variety of metrics.
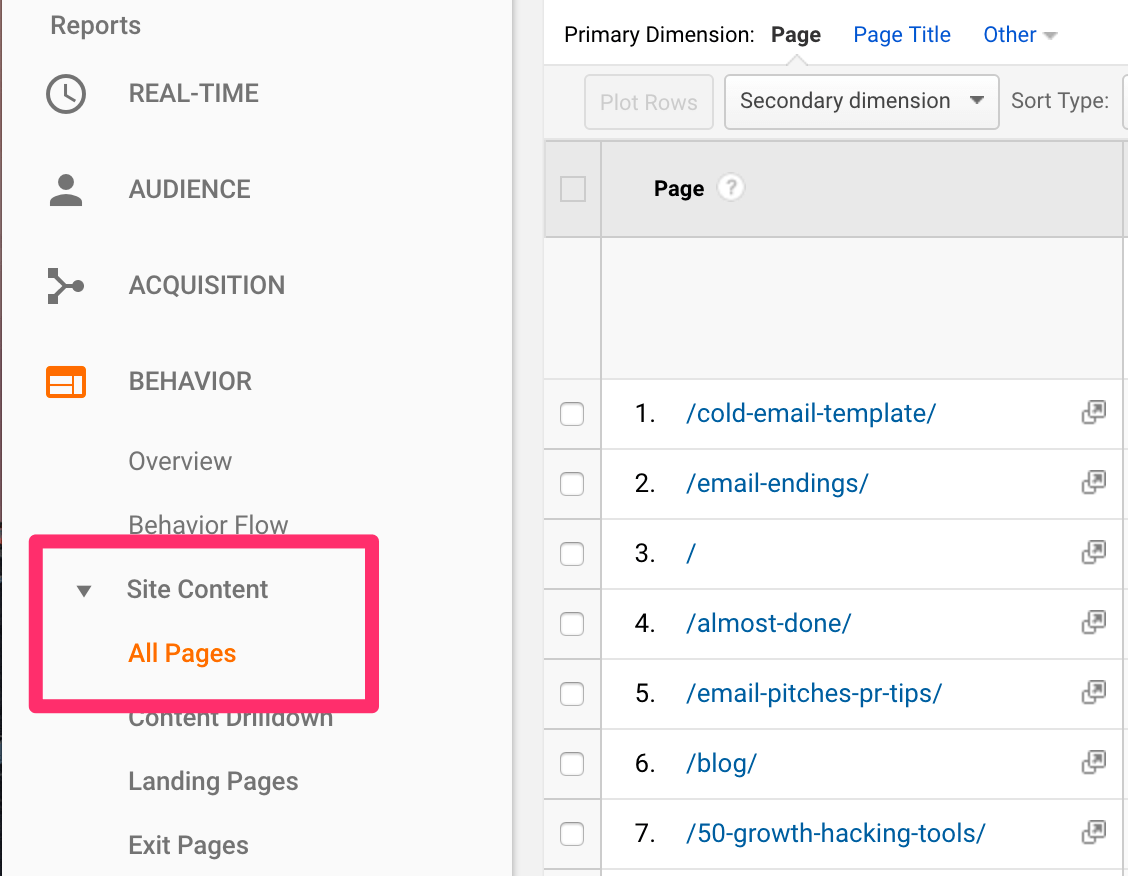

From here, you’ll want click (or search) for the appropriate URL.
Next, you’ll want to compare against the previous period using the dates drop down in the top right corner.

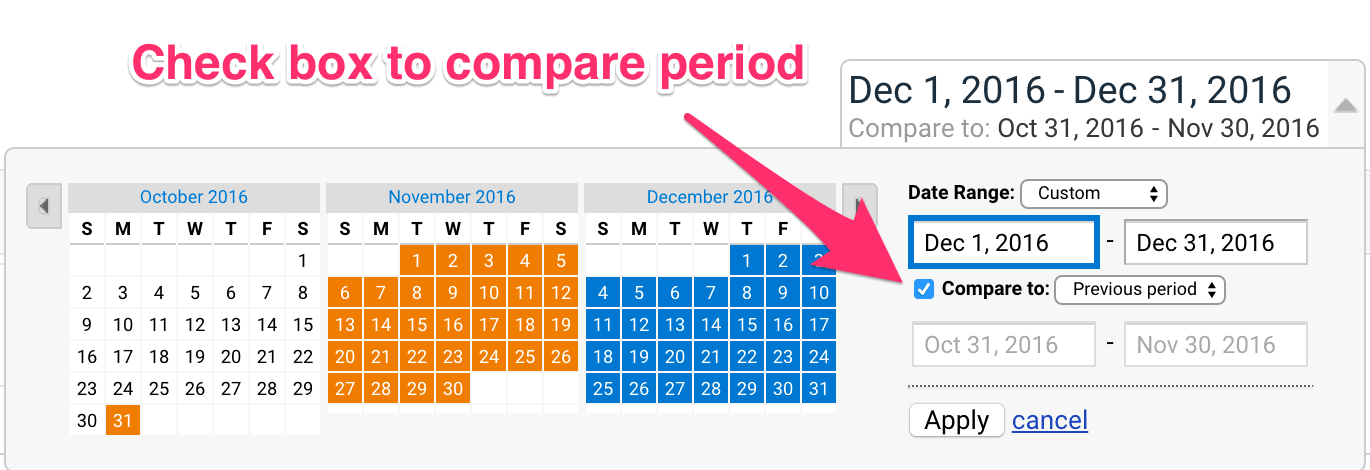
From here, you can see how your post has been improving over the last 30 days (or whichever period you desire).
Tracking Search Volumes
To track search volumes, simply use the same process outlined in Step 1. Open your Google Search Console and use the Search Traffic -> Search Analytics report then click on the “Pages” radio button.
From here, you can track how the ranking of the post improves over time.
Wrapping Up
As we’ve demonstrated, improving engagement on your post through the use of custom graphics can make quite a significant impact.
If you’re looking to improve existing content, we recommend identifying pages that are already ranking, adding custom graphics, and monitoring the results.